Miami Real Estate Reports
The Analytics Miami reports are independent research, not paid for by brokerages. The reports are unbiased towards any outcome and are presented without hype. We believe in letting the data and the charts speak for themselves.
Understanding where we are in the current market cycle is a key factor to consider when making investment decisions. All markets move in cycles and have directionality; nothing goes up forever and nothing goes down forever. Reporting quarter- over-quarter is not enough to reveal the prevailing trend. Analytics Miami reports show at least 10 years of data, thus shedding light on market directionality.
2023 Q4 & 2024 Forecast: Miami Dade Real Estate Report
The Wealth & Talent Migration Continues
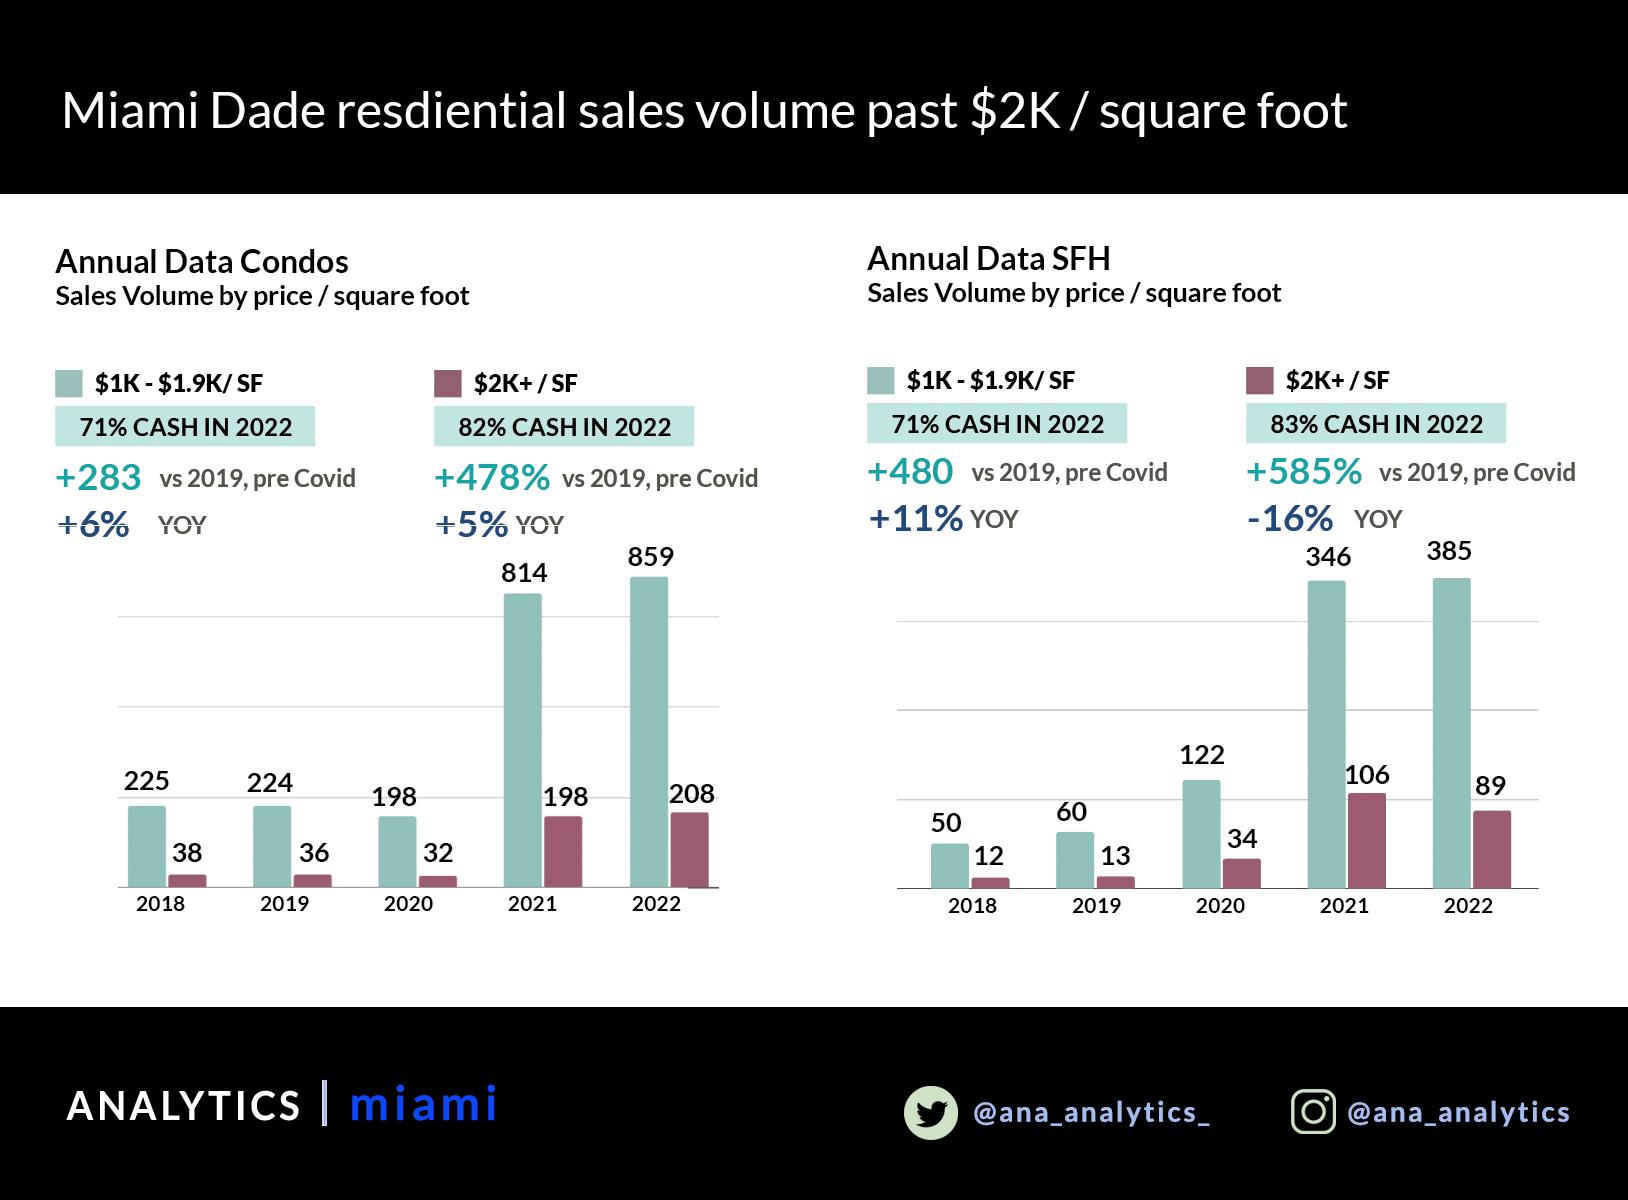
Census data, IRS data, license plate data, etc... all keep quantifying the ongoing wealth and talent migration. We see the appetites of the new buyers reflected in the extreme spikes in sales past $1K and $2K / square foot. Most notably, SFH past $2K / SF remain over 5x higher than 2019, pre-Covid.
The Market Is Stabilizing Around New Realities
Median prices are starting to plateau around new, post Covid levels. Sales volume at prices higher than $1M remains above pre Covid levels, while lower price points are below. And the SFH market is slightly diverging from & outperforming the condo market, as we cannot add inventory vertically.
2023 Q3: Miami Dade Real Estate ReportAnalyticsMiami
Median Pricing Plateauing, cash high
Median condo pricing finished Q3 2023 up 5% YOY You can see the plateau forming in the chart. The usage of cash edged higher to 70% over $1M and at 48% sub $1M. The very highest segments of the market have once again proved most resilient as the wealth & talent migration continues.
Inventory & Volume Below $1M
Inventory below $1M dropped to 58% below pre Covid realities. If we drill down further, inventory below $200K has dropped a shocking 84% since 2019 (page 6). Interest rates add friction, but the combo of low inventory and 50% cash usage sub $1M provides a floor.
2023 Q1: Miami Dade Real Estate ReportAnalyticsMiami
Median Pricing Plateauing, cash high
Median condo pricing finished Q1 2023 flat year-over-year. You can see the plateau forming in the chart. The usage of cash edged higher to 70% over $1M and at 52% sub $1M. The very highest segments of the market have once again proved most resilient as the wealth & talent migration continues.
Inventory & Volume Below $1M
Inventory below $1M dropped to 62% below pre Covid realities. If we drill down further, inventory below $200K has dropped a shocking 87% since 2019 (page 6). Interest rates add friction, but the combo of low inventory and 50% cash usage sub $1M provides a floor.
2022 Annual & 2023 Forecast: Miami Dade Real Estate ReportsAnalyticsMiami
Sales Volume At High Prices / SF
The wealth and talent migration is seen when we chart sales past various price-per-square-foot thresholds. The condo market past $2K/SF had a record year, almost 5X higher than pre Covid, and was 82% cash. Whole new market segments are emerging, and they are a reflection of incoming appetites.
Inventory & Volume Below $1M
Inventory below $1M remains almost 60% below pre Covid realities. While below 2021 highs, sales volume is still up for the year versus pre Covid in 2019. Interest rates add friction, but the combo of low inventory and 50% cash buyers provides a floor.
Analogous to record 2022 sales vol posted by RollsRoyce & Lamborghini.
Upper echelons of #MiamiRealestate posted record 2022.
The wealth & talent migration out of high tax, high lockdown states is very real. As is the growing wealth gap.
2022 ReportsAnalyticsMiami
Q2 2022 South Florida Real Estate Report & Forecast
South Florida’s cash tsunami and the Great Pandemic Migration are reshaping America.
A major shift in focus is underway.
$1M+ Sales Are Strong
Sales volume past $1M remains almost 3x pre-Covid levels. Tri-county, sales dipped 5% YOY while all cash purchasing held strong at 64%. This market segment is positioned to keep benefitting from the reshaping of America that is underway.
<$1M Sales Fall to Pre Covid Levels
Sub $1M sales took a dive in Q2 2022. The drop in sales volume accelerated into June, with the month recording 32% fewer sales than June 2021. While sales volume is at pre-Covid levels, inventory remains down 60% and median days to sell is at lows. The market has a floor.
Q1 2022 Miami Real Estate Report & Forecast
The flight of capital and talent continued with no sign of abatement.
A major shift in focus is underway.
$1M+ transactions on fire
Transactions above $1M were up 6x in Q1 2022 versus pre Covid levels in Q1 2019. The biggest jump in Q1 2022 was in $1M+ condos, with transaction volume up 9.5x versus pre Covid. Q1 2022 had more $1M+ condo transactions than previous calendar years.
Inventory at record low & falling
Inventory continued to steadily fall throughout Q1 2022, Aggregate city-wide inventory fell a staggering 62% versus the same time period in 2019. Sub $1M condos had the biggest drop versus pre Covid levels, with inventory falling 69%.
2021 ReportsAnalyticsMiami
2021 Annual Report & Forecast
South Florida's Cash Tsunami & The Great Pandemic Migration are Reshaping America
Dollars Spent At All-Time Highs
$77.5B was spent in South Florida in 2021, thats an extra $38B compared to the same time period in 2019. While dollars spent rose 96%, properties sold rose 28%. The surge in spending is fueled by $1M+ properties, as capital relocates to the region.
Inventory At All-Time Lows
Active listings continued to fall in each county and across all price segments. Overall, tri-county inventory for condos & SFH fell a staggering 58% versus the same time in 2019.
2021 Annual Report & Forecast
Miami’s record shattering year is the new normal, as the flight of capital continues.
Flow of money at record high
Almost twice as much money was spent on condos & SFH in the city of Miami during 2021 versus pre-Covid levels in 2019. Sales volume rose only 31% for the same period, indicating that the surge is driven by demand for higher priced properties.
Inventory at record low
Inventory continued to steadily fall throughout 2021, reaching all time lows across property types and across price points. Aggregate city-wide inventory fell a staggering 50% versus the same time period in 2019.
2021
South Florida Cash Tsunami, Real Estate Report
Data is through Q3 2021
Dollars Spent At All-Time Highs
$59B was spent in South Florida Q1-Q3 2021, thats an extra $29B compared to the same time period in 2019. While dollars spent rose 95%, properties sold rose 31%. The surge in spending is fueled by $1M+ properties, as capital relocates to the region.
Inventory At All-Time Lows
Active listings continued to fall in each county and across all price segments. Overall, tri-county inventory for condos & SFH fell a staggering 51% versus the same time in 2019.
2021
Magic City Miami Real Estate Report
Data is through Q3 2021
FlowOf Money At Records High
Almost twice as much money was spent on condos & SFH in the city of Miami during the first three quarters of 2021 versus pre-Covid levels in 2019. Sales volume rose only 31% for the same period, indicating that the surge is driven by demand for higher priced properties.
Inventory At Record Low
Inventory continued to fall into Q3, reaching all time lows across property types and across price points. Aggregate city-wide inventory fell a staggering 42% versus the same time period in 2019.
2020 & 2019 ReportsAnalyticsMiami
2020
Supply and Demand: Miami and Miami Beach condos
Data is through Q4 2019
Extreme Disconnect
There is a fundamental supply & demand disconnect in the Miami area luxury condo market. Since Q4 2013, the Miami $1M+ condo market saw a 178% increase in supply. Demand decreased 18% in the same time frame.
Cash Was King
This last cycle was fueled by cash buyers. At 2013 volume highs, Miami Beach was 76% all cash and Miami was 70%. In 2019 those numbers were 61% and 42%. The high % of cash means there is low debt service pressure, which may be why we are seeing listings languish.
2020
State of the Market: Miami Beach Condos
Data is through Q4 2019
Destination Money
The current market cycle catered to and was driven by destination money. The average 2019 resale price for a condo built post 2000 was $1.6M. Virtually
no inventory was added at price points catering to in-place demand.
Cash Was King
The current market cycle was fueled almost entirely by cash. At transaction volume highs in 2013, 76% of condo sales were cash. 2019 transaction volume was 37% below 2013, and that drop is due entirely to the loss of cash buyers.
Q3 2019
Supply and Demand Report: Miami area condo market
Supply and Demand Disconnect
Inventory has steadily risen across market segments, all while transaction volume has dropped off. Higher price points are the worst offenders. The Miami $1M+ market saw a 147% increase in supply since 2013, while sales dropped 32% in the same period.
Transaction volume below 2010
Miami Beach and Miami condo transaction volume remains below the post-recession numbers we saw in 2010. For most market segments transaction volume peaked in 2013, and has since been dropping. Recent changes to SALT deductions have not offset the volume decline.
2017 & 2018 ReportsAnalyticsMiami
AnalyticsMiami Special Report: Miami Condo Inventory, start of 2018
This report charts months of Miami condo inventory, going back to 2007. The charts show that the Miami condo market is at all-time high levels of inventory. Some prices points have almost twice as many months of inventory as during the last downturn.AnalyticsMiami Long term trends, Miami-Dade condo report 2017
This report shows all key Miami condo market metrics, charted back to 2006. The data indicates that we are at various extremes in the condo market cycle. Also indicated is a clear bifurcation between locally supported and outside money dependent price segments.AnalyticsMiami Special Report: Miami Beach condo market through Q2 2018
Q2 2018 saw a record number of $3M+ condo transactions in Miami Beach. After years of declining sales volume, sellers are starting to meet buyers. The oceanfront luxury condo market is starting to clear at 2013 prices, and high profile hedge fund managers are leading the way.AnalyticsMiami City of Miami Beach, The Missing Middle Report, February 2018
In February 2018, Ana Bozovic gave a presentation the city of Miami Beach's land use committee. The presentation is entitled "The Missing Middle." It charts long term trends in Miami Beach's population and housing stock. The results are clear: Miami Beach has added virtually no new housing stock for middle class residents and has a housing market increasingly dependent on outside money.Ana Bozovic
Are you looking for an asset? looking to sell an asset? Or in the need of guidance?