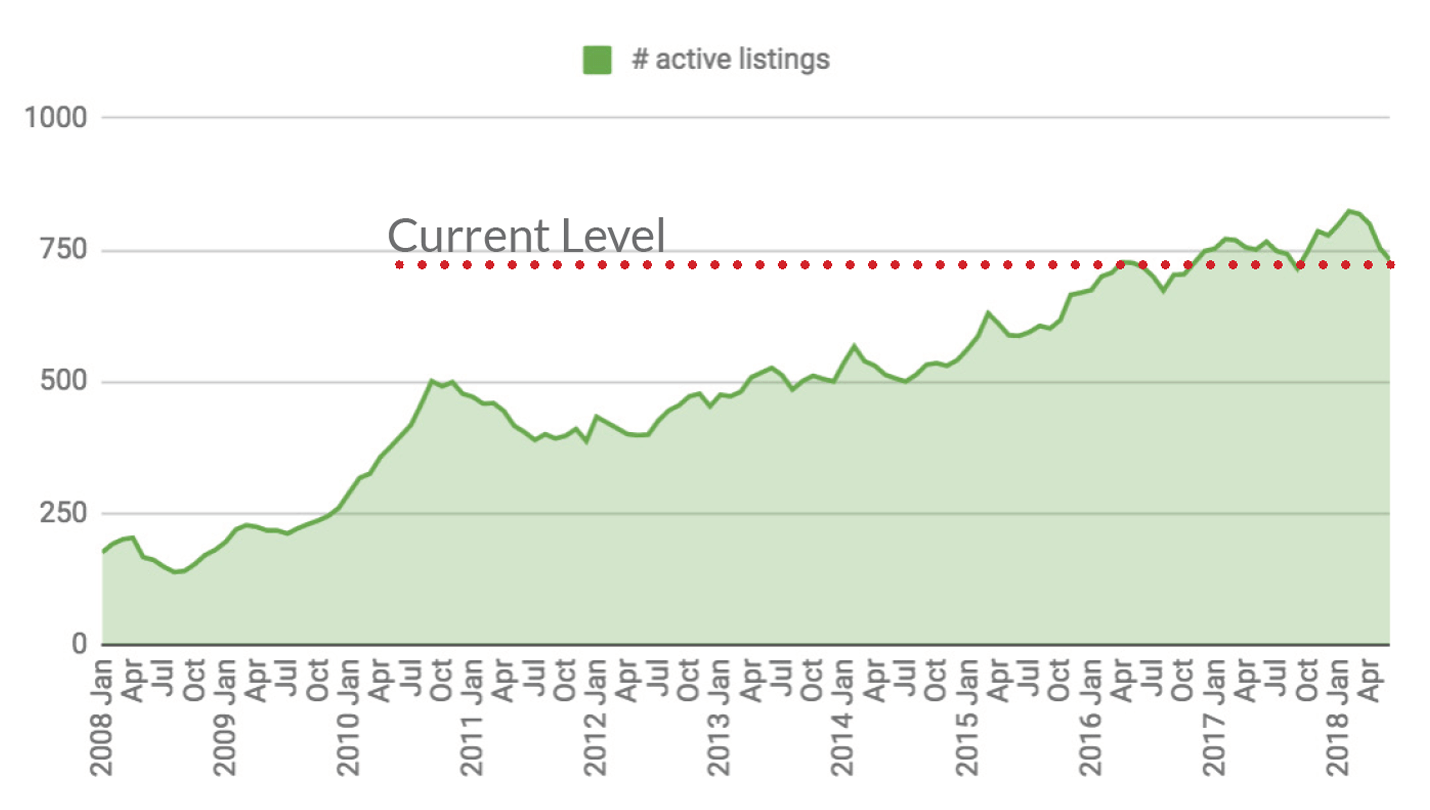
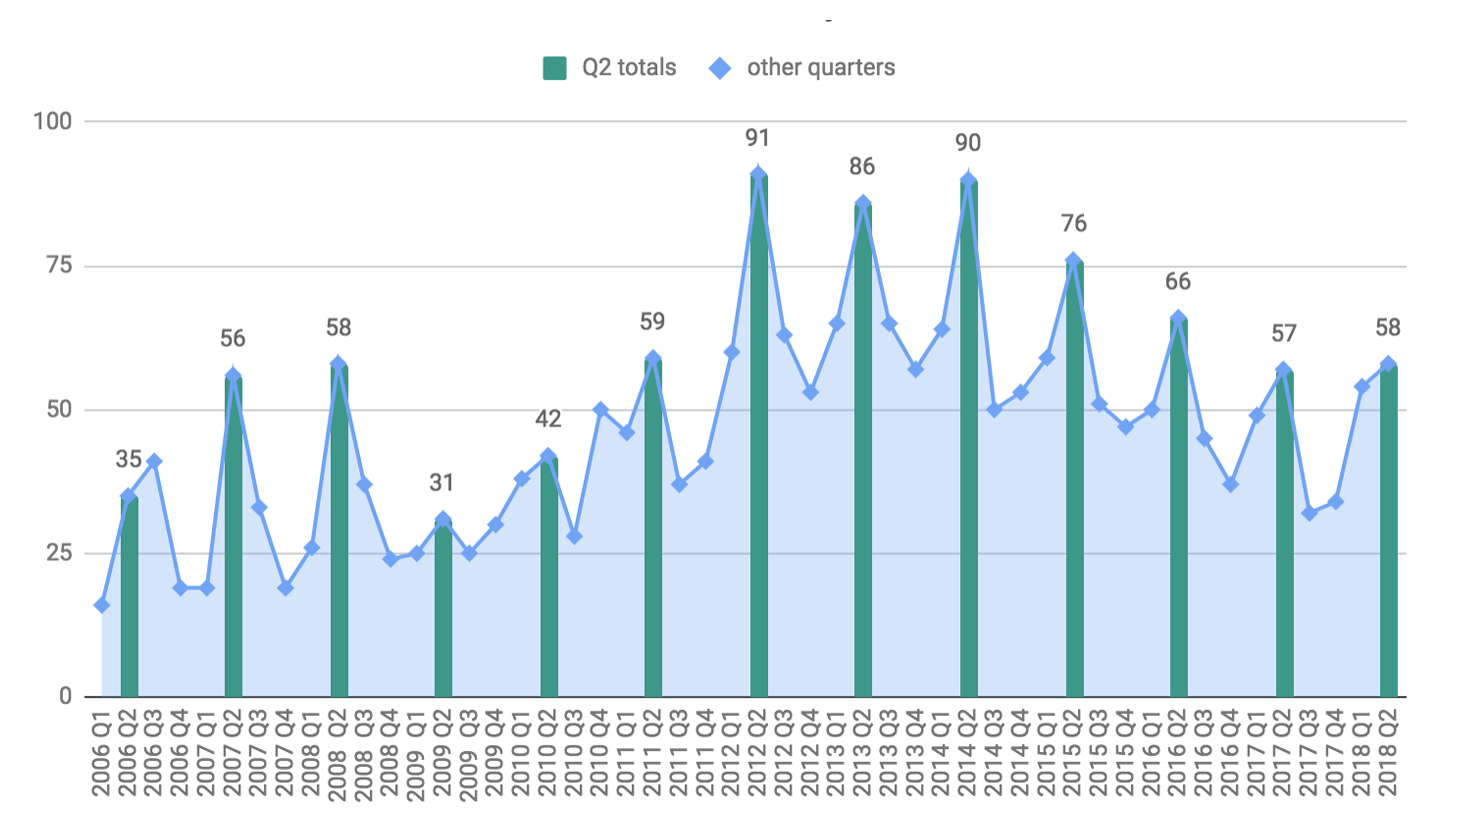
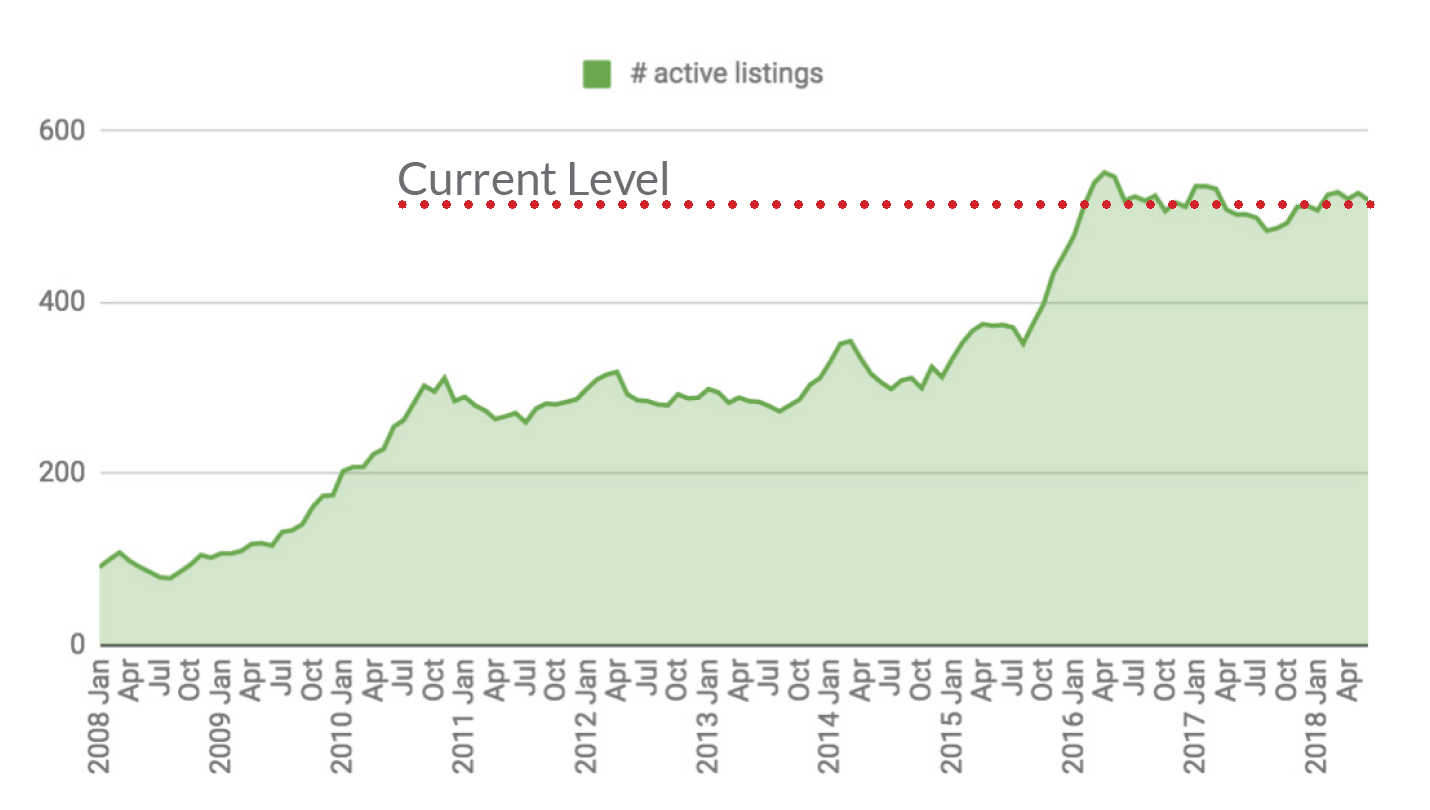
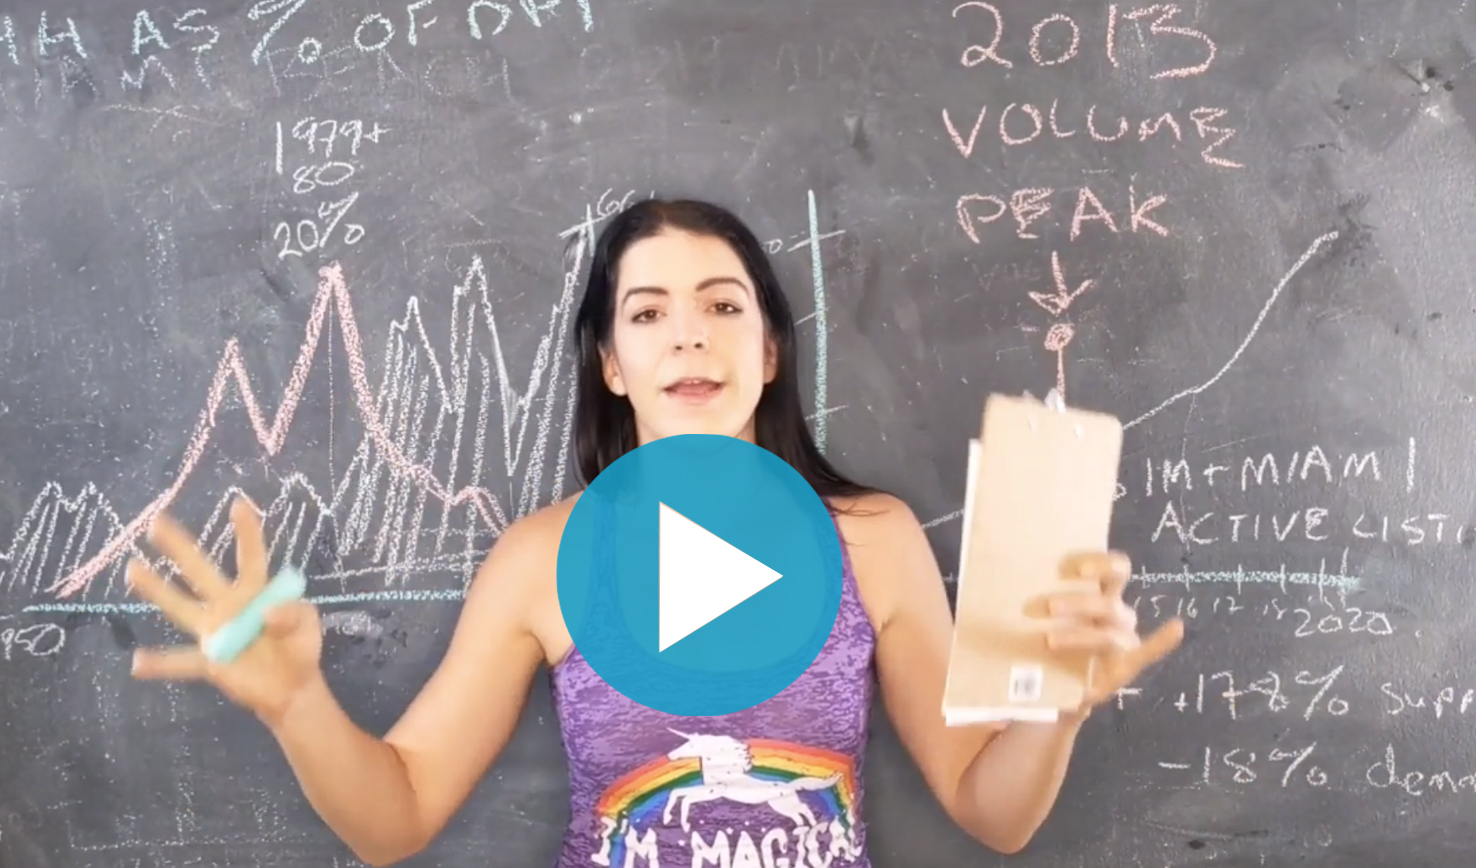
There is a fundamental disconnect between supply & demand in the Miami and Miami Beach condo markets. Inventory has steadily risen across market segments, all while transaction volume has dropped off. Higher price points are the worst offenders. The Miami $1M+ market saw a 147% increase in supply since 2013, while sales dropped 32% in the same period
Q2 2018 Miami Beach Condos: Records $3M+ Sales, Luxury Condos at 2013 Prices
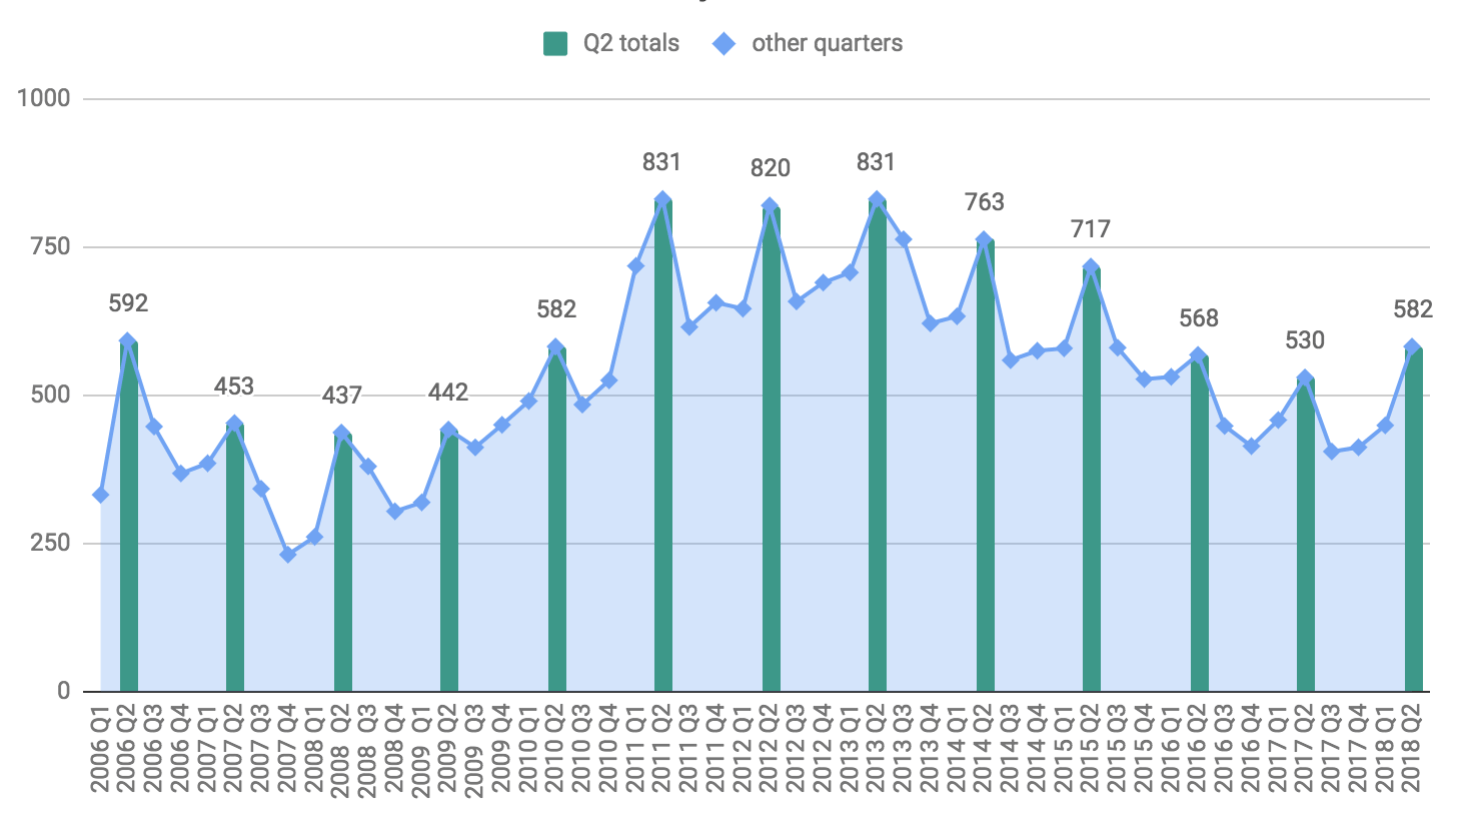
Liquidity is coming back: first year-over-year increase in volume since 2013
Summary of findings:
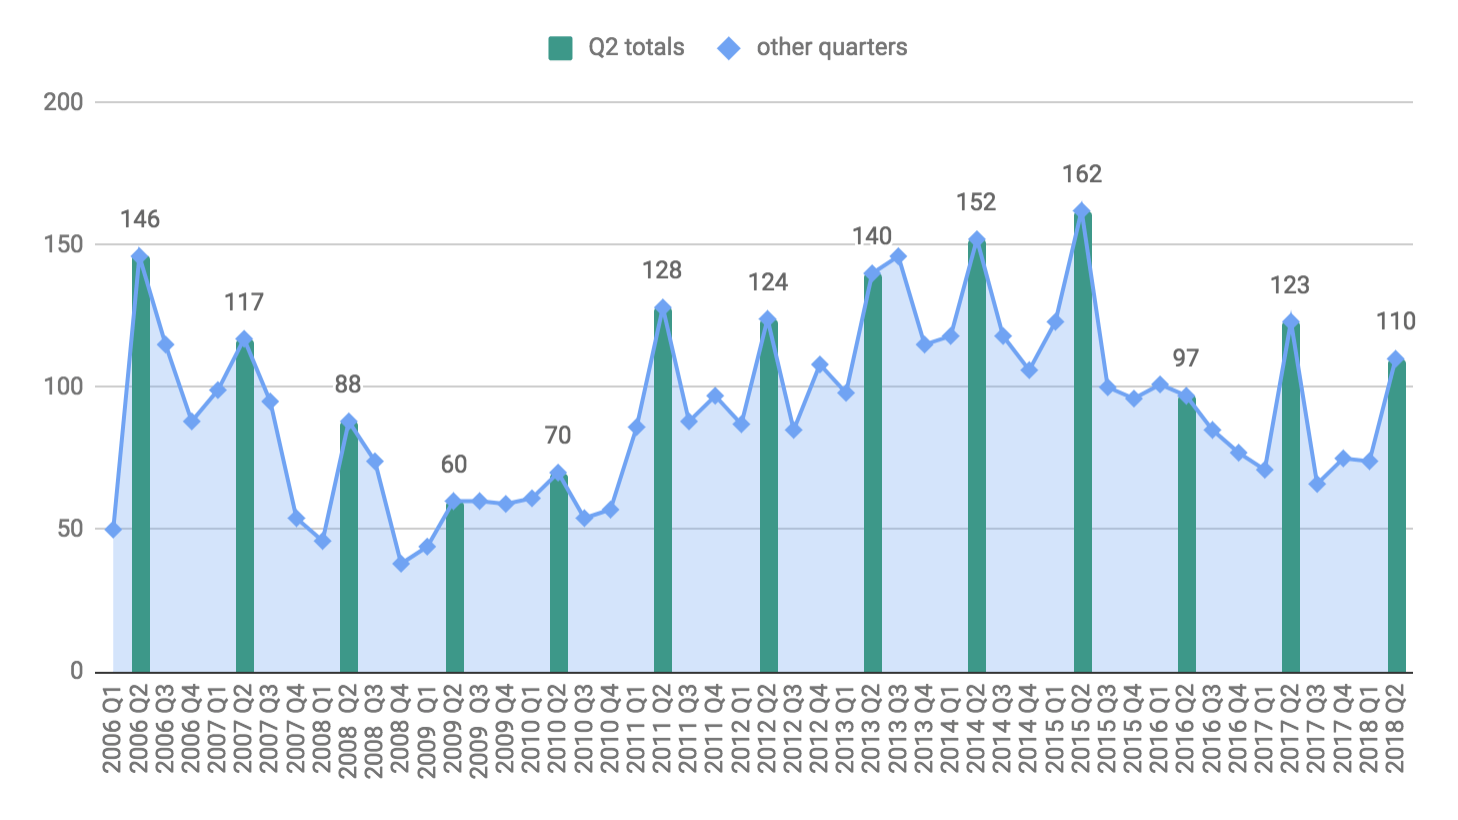
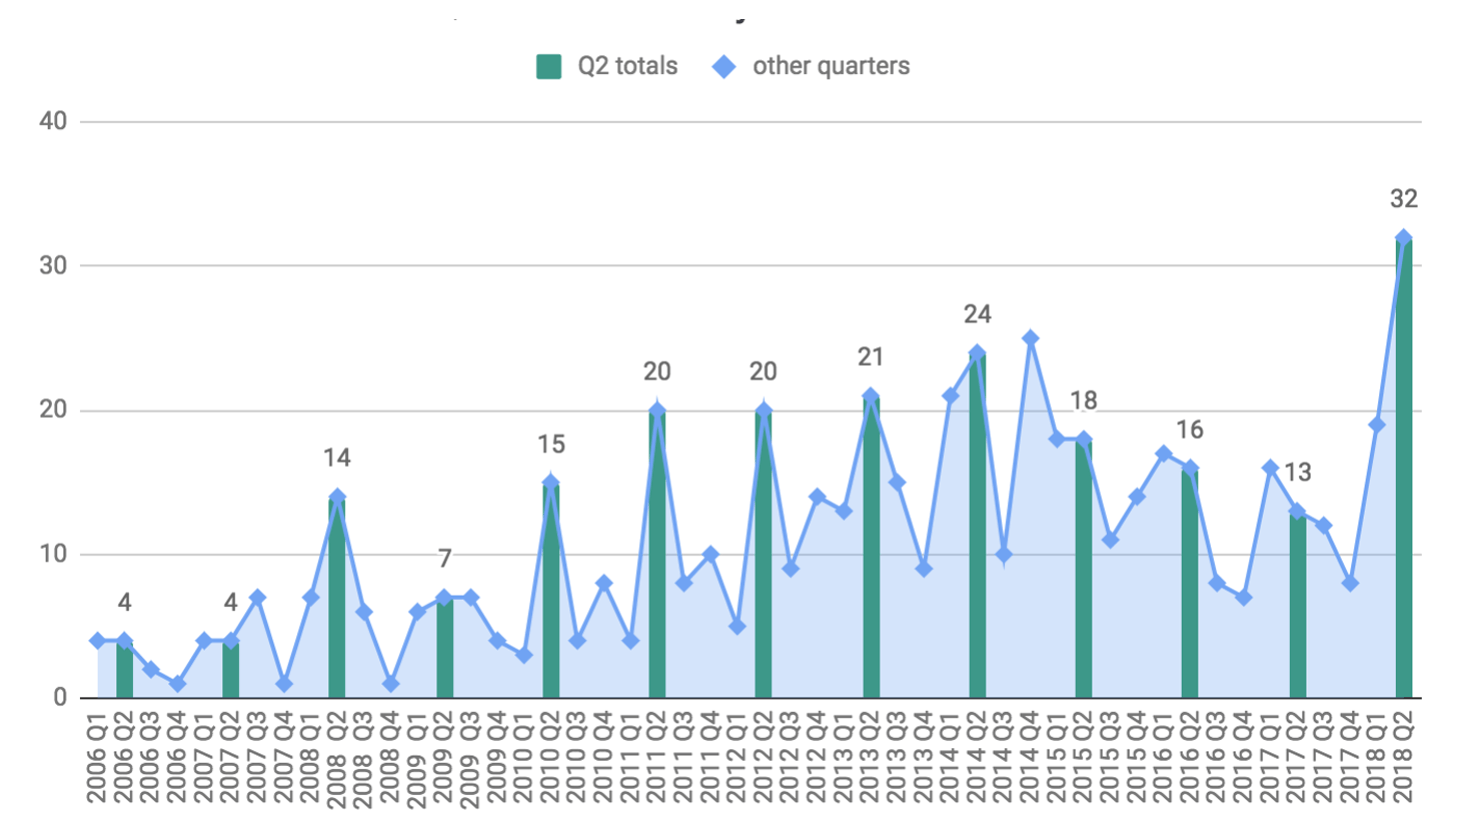
The sales volume decline that began in 2013 appears to have ended in the second quarter of 2018. Higher transaction volume was driven by properties under $500K and over $3M, with the middle ground remaining weak. The second quarter saw a record number of $3M+ condo sales, as high-end properties began to trade at large discounts.
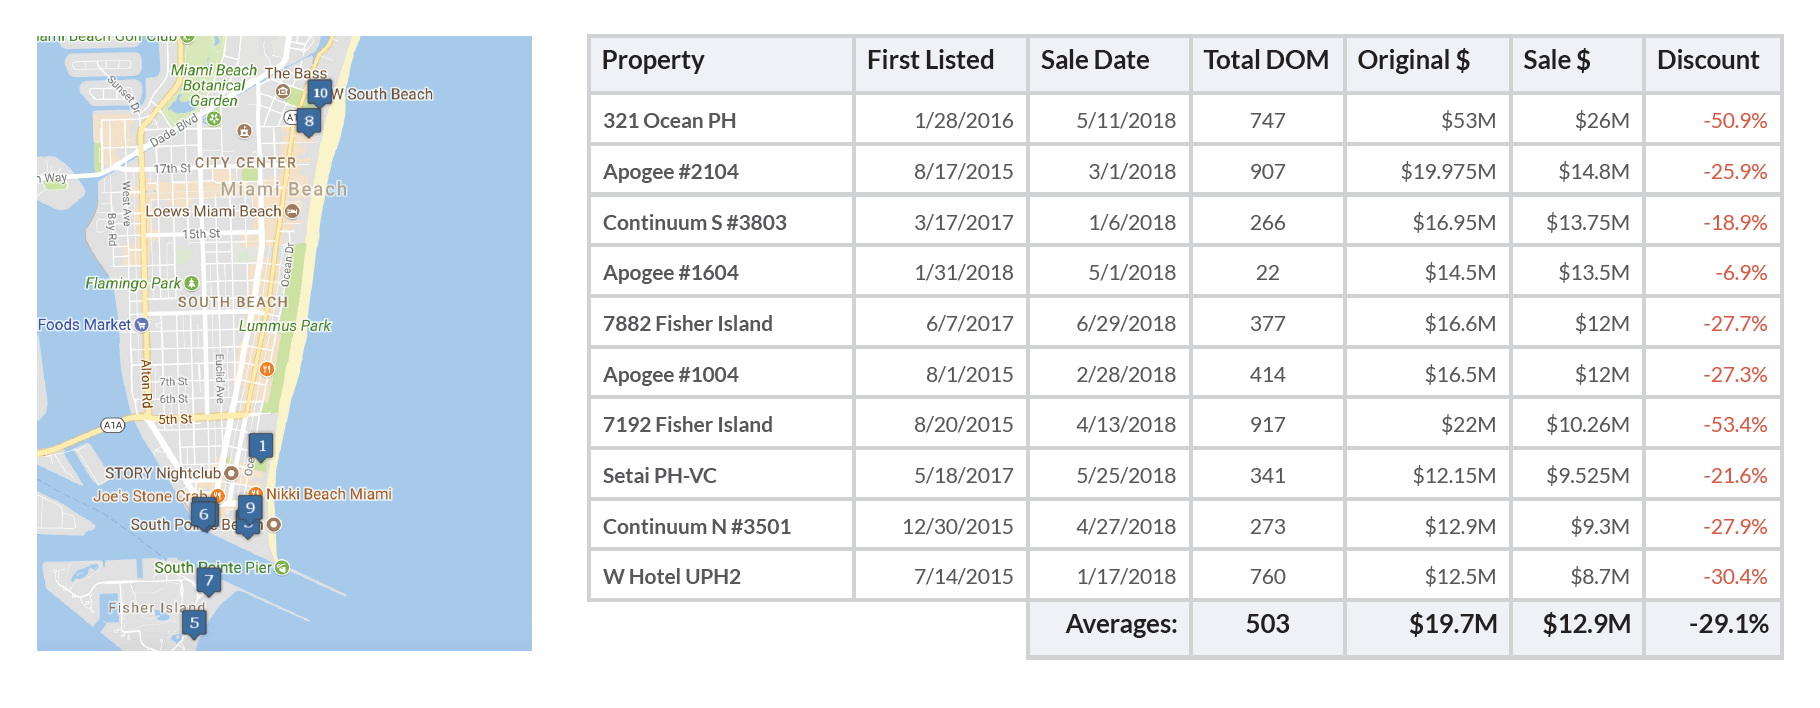
Premiere oceanfront property has intrinsic value, and there will always be buyers at realistic prices - it's now clear that the handful of 2015 and 2016 sales near $3000/sqft did not reflect intrinsic value, but the top of a hype cycle. As for who is buying now, US residents rather than foreign buyers are prominent, such as hedge fund managers moving from high-tax states. Cliff Asness of AQR Capital Management has made the most expensive purchase year-to-date, paying $26M for the penthouse at 321 Ocean. That property sold for 50% off of its original asking price.
Market snapshot: Miami Beach top 10 condo sales Q1 - Q1 2018
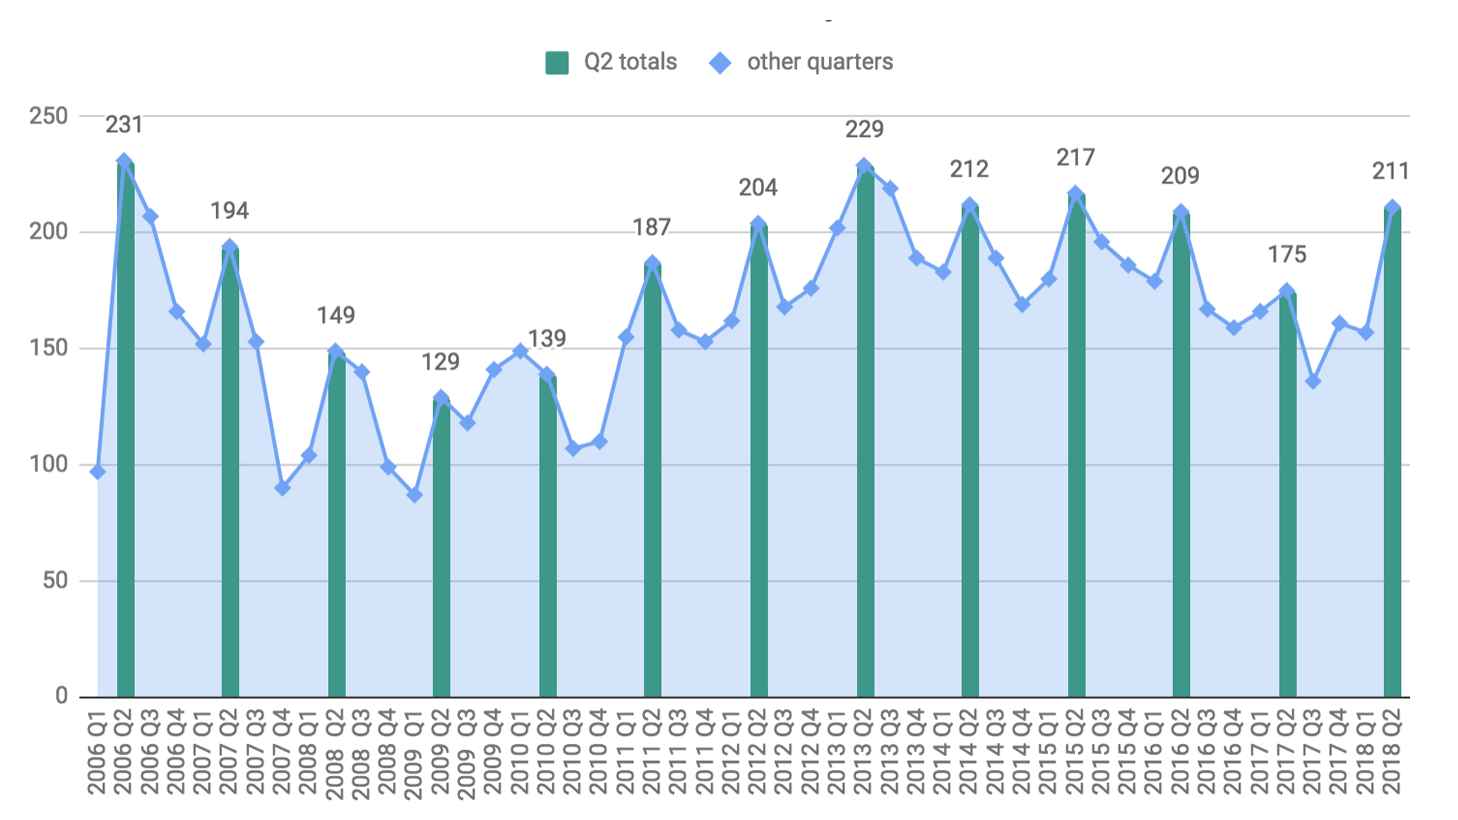
Miami Beach condo sales volume rose 9.8% from Q2 2017.
First break in transaction volume decline since 2013, due to increase in sub $500K and $3M+ sales.
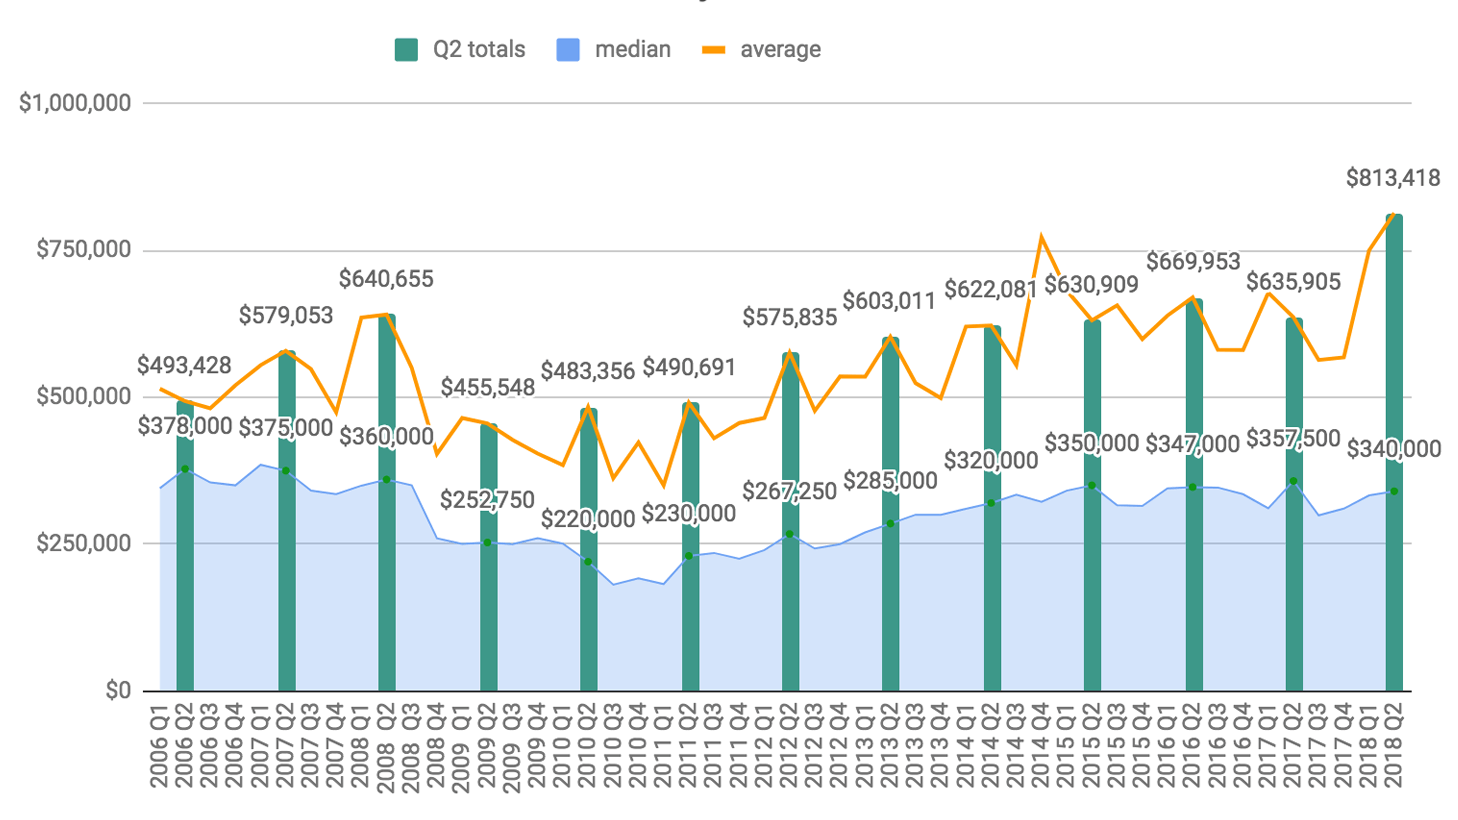
Median prices are trending down, are now well below 2007 highs
Average price spiked up do to record volume in the $3M+ price range.
Average prices are boosted by new construction, many existing buildings are trading below 2013 prices.
Average price spiked up do to record volume in the $3M+ price range.
Average prices are boosted by new construction, many existing buildings are trading below 2013 prices.
Miami Beach Condo Market: Quarterly Average & Median Prices Through Q2 2018
Source: Miami MLS.
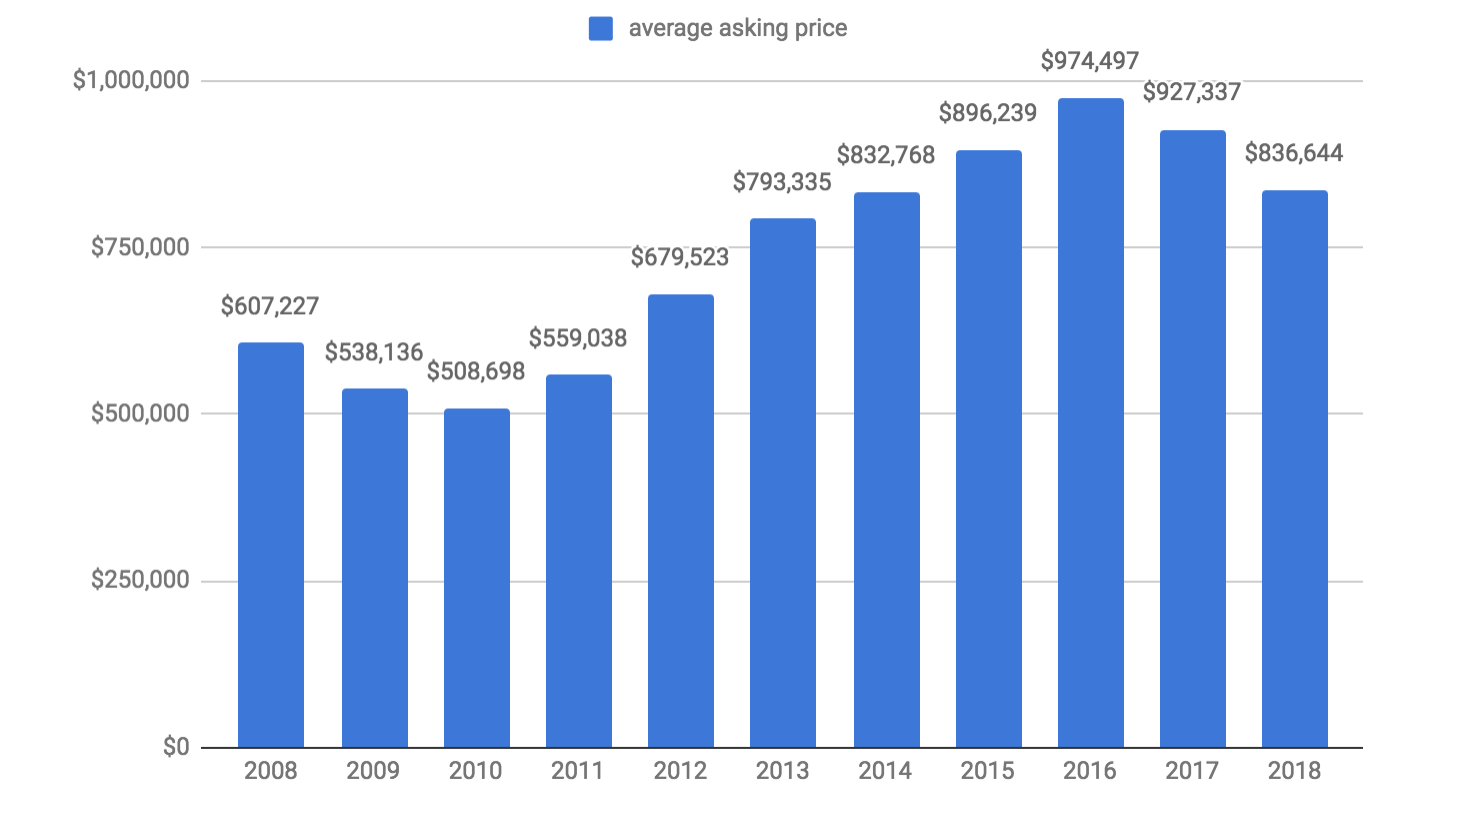
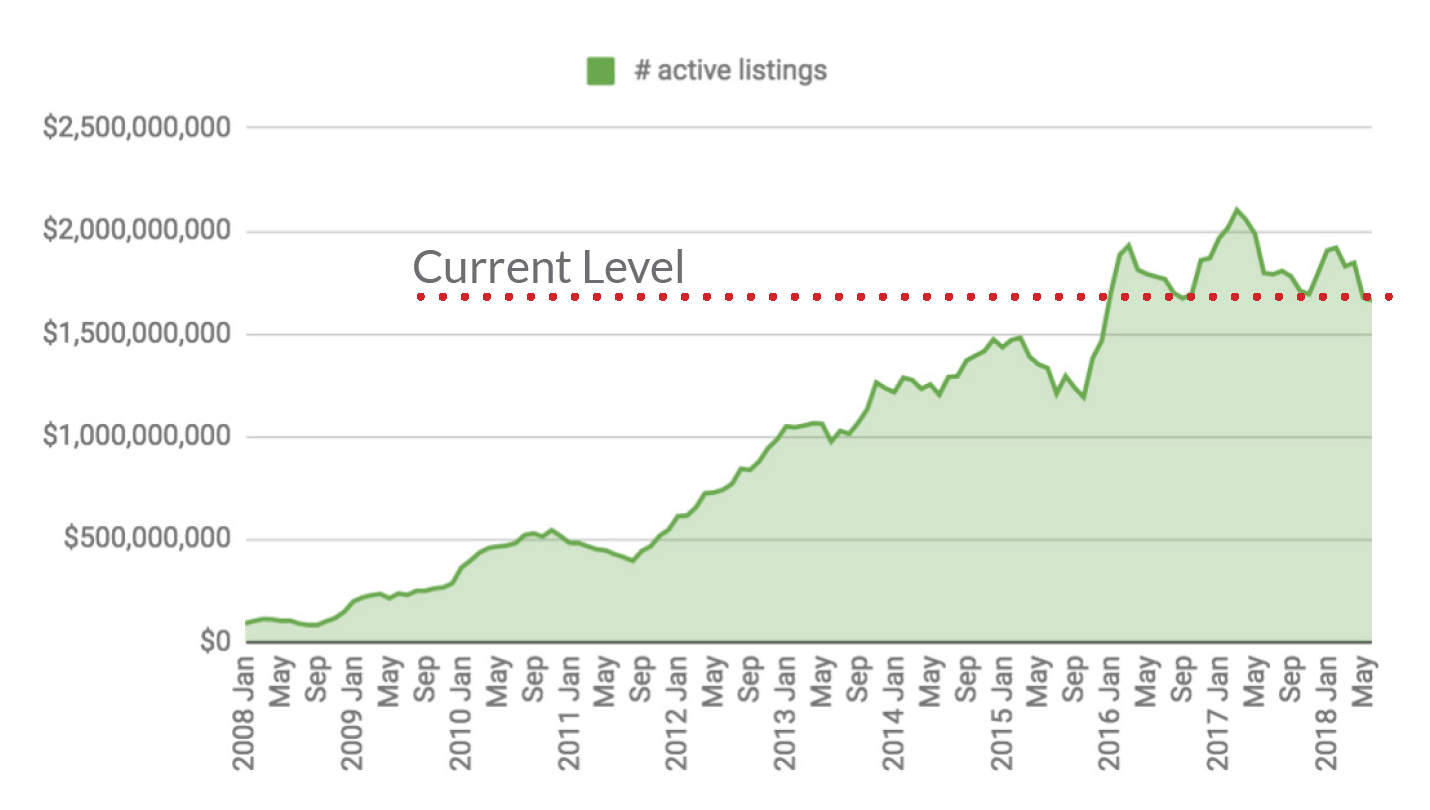
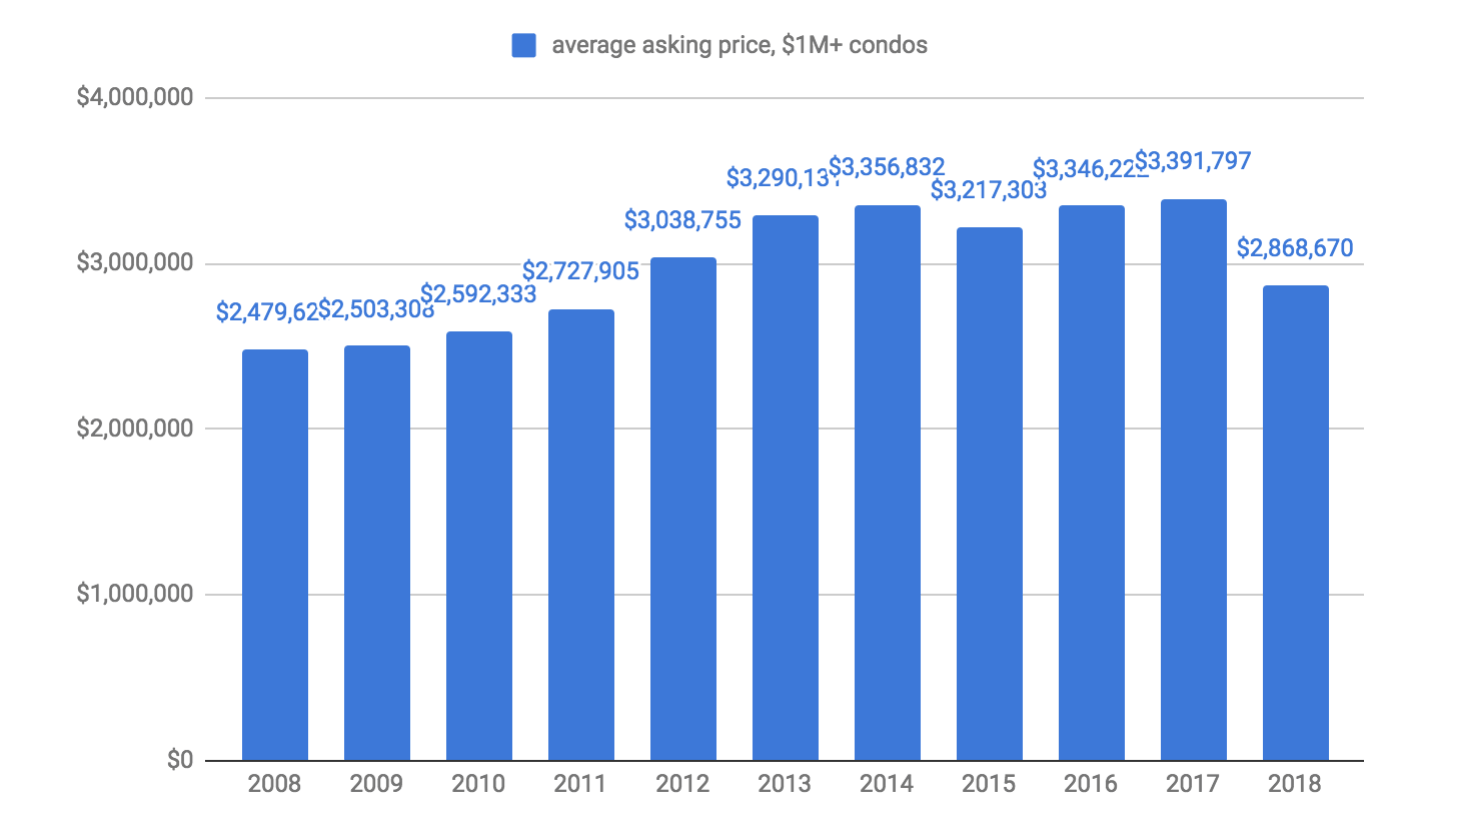
The Average Asking Price For A Miami Beach Condo Drops To 2014 Levels As High-End Condos Sell At Steep Discounts.
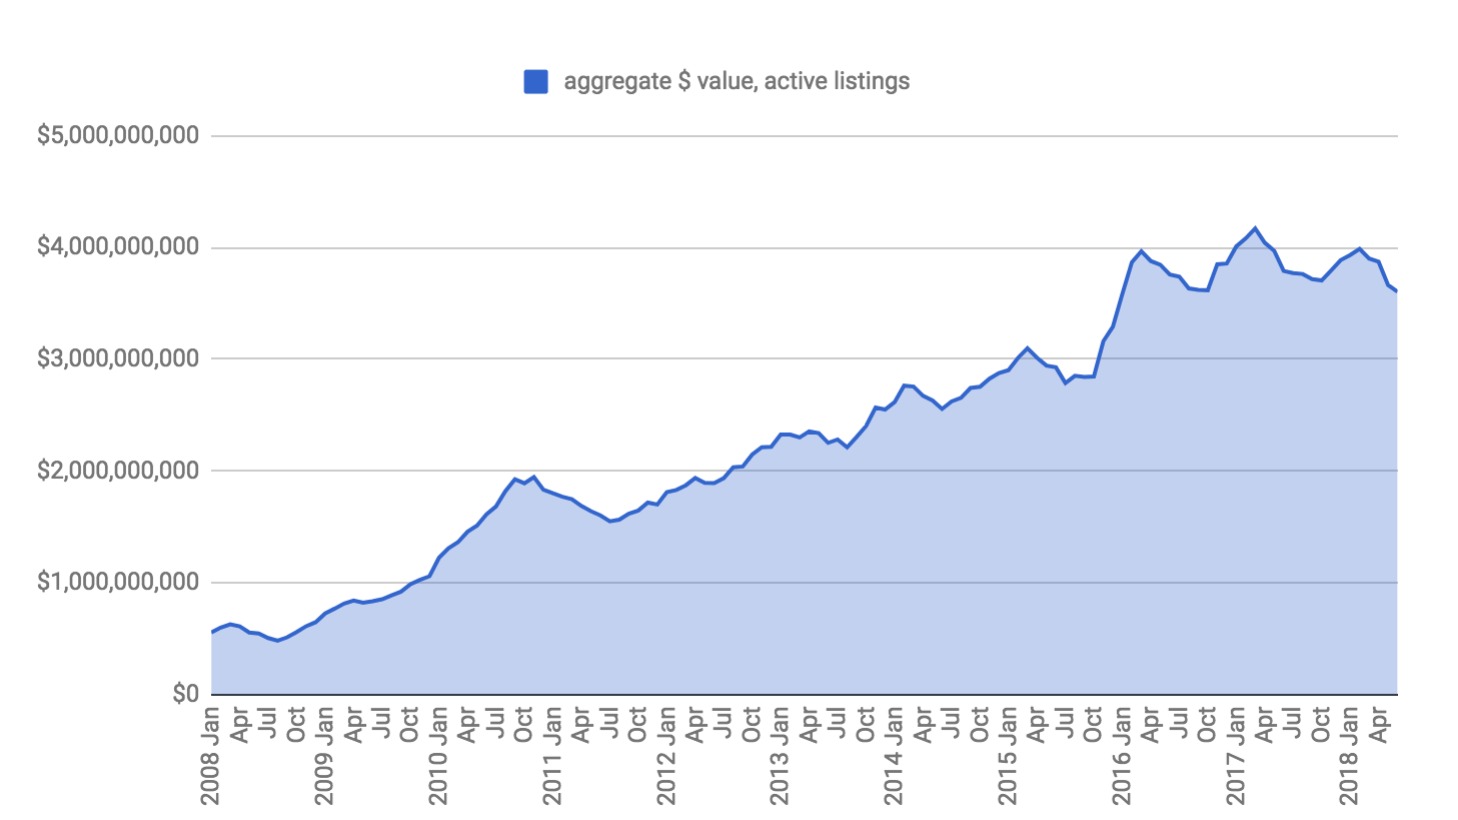
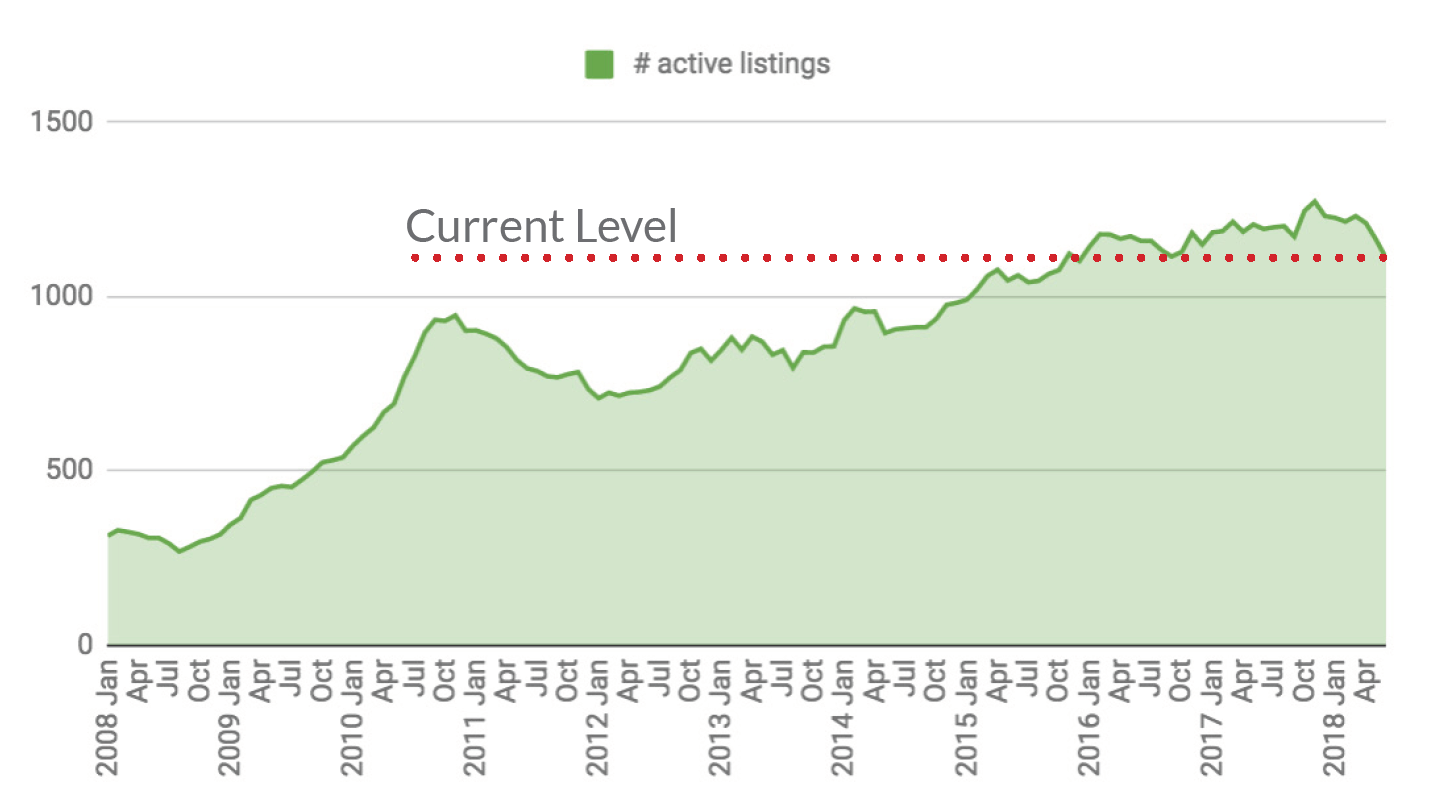
The aggregate value of all actively listed properties dropped, indicating that high-end inventory is finding buyers as prices drop to pre 2014 levels.
High end condo inventory is starting to clear as prices adjust, middle is languishing.
Miami Beach Condos, $250K - $499K.
Miami Beach Condos, $500K - $999K
Miami Beach Condos, $1M - $2.99M
Miami Beach Condos $3M+: Records Transaction Volume Through Q2 2018
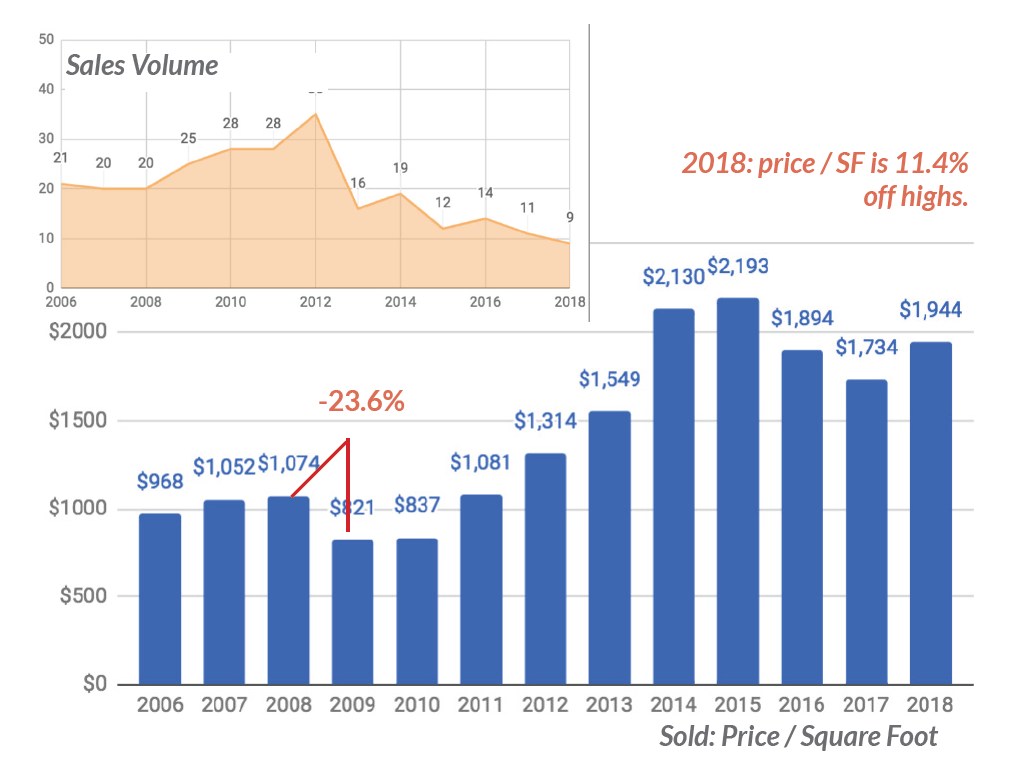
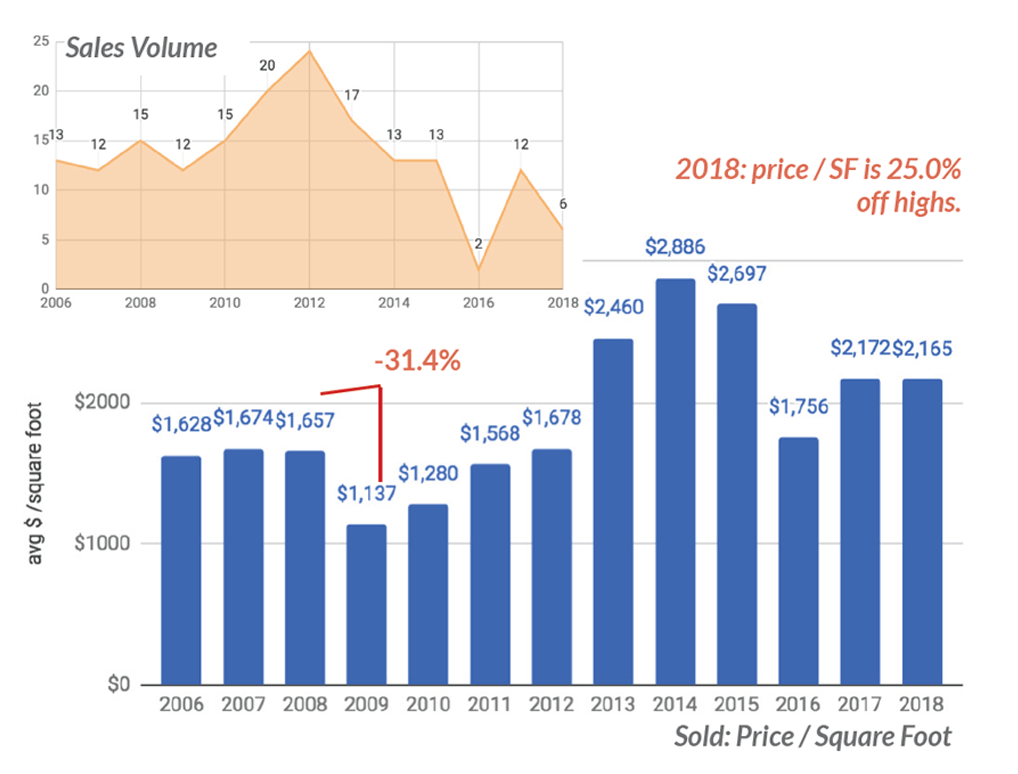
Luxury, waterfront inventory is starting to clear as prices per square foot dip below 2013. Oceanfront has intrinsic value, and this segment of the luxury market is outperforming mainland locations.

