Feb 2026 General Market Update • Market Opportunities • Billion Dollar Miami Tour With Cristiano Piquet • Ana on Jay Roberts The Long Game General market update, February 2026: Miami Dade median SFH price: $685K, up 5% year-over-year Miami Dade median Condo price: $415K, down 8% year-over-year Condos built post 2010, median price: $715K, up 15% year-over-year, and at an all time high. This illustrates the divide in performance between new and old condo inventory. Given that Miami now has the highest concentration of millionaires in the nation, we can expect a to see ongoing market divergence. Segmentation is critical.
Q3 2024 Miami Real Estate Report Preview
Last week I published a detailed analysis & charts of all-cash buyer percentages throughout South Florida.
You can read that post here >
By popular demand, this week, I expanded upon this topic with a discussion of how one defines an asset bubble.
Download my full Q2 2024 Miami Real Estate Report
Q3 2024 has just closed out!
The data continues to trickle in. I will have my full Q3 report ready for you next week.
This evening I would like to share a preview of some of the initial findings.
Spoiler alert: the #LongMiami and South Florida thesis keeps playing out.
Segments successfully catering to the wealth & talent migration:
-> New product in prime location.
-> Throw in in inherent scarcity, and you get the phenomenon that is our high-end SFH market.
4 initial charts are below in this email. They cover these points:
1) Miami Dade median pricing – holding strong, SFH at all time highs
SFH hit all time highs, condos off highs but still up 1.2% YOY
Contrary to some doomsday headlines pertaining to the condo market, there is no precipitous drop in pricing. The doomsday headlines are not reflected in the data.
And as I keep saying: we can’t add more inventory vertically when it comes to SFH.
(more on that point below, the divergence from the general condo market is very real)
2) SFH inventory below $500K – continues to disappear
This is a real factor when it comes to affordability.
Active SFH below $500K are down 85% vs Sep 2019. They are basically disappearing. There are fewer than 600 when there used to be 3,700+.
3) SFH sales volume past $1K and $2K / square foot.
Q1 – Q3 Sales past $1K: up 812% vs 2019
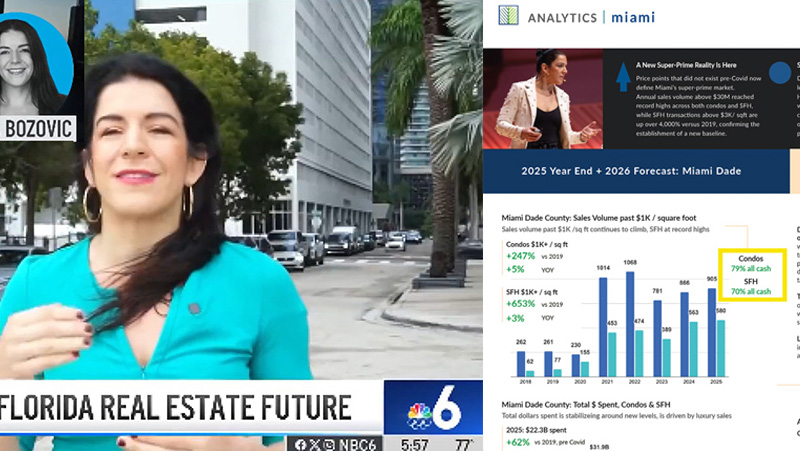
4) Condos sales volume past $1K and $2K / square foot.
Q1 – Q3 Sales past $1K: up 193%% vs 2019
Note: these are resales. I will do a follow up study including preconstruction numbers, which will make this more in alignment with the SFH % change.
Remember, when it comes to condos: there is great demand for new product that is also SFH replacement.
===
1) Miami Dade median pricing – holding strong, SFH at all time highs


2) SFH inventory below $500K – continues to disappear
Sept 2024: 558 active listings
Sept 2019: 3,760
-85% vs. Sept 2019, per Covid

3) SFH sales volume past $1K and $2K / square foot.
Q1 – Q3 Sales past $1K: up 812% vs 2019

4) Condos sales volume past $1K and $2K / square foot.
Q1 – Q3 Sales past $1K: up 193%% vs 2019

Get on Ana’s List
I personally work with a select number of buyers every month.
Related Posts