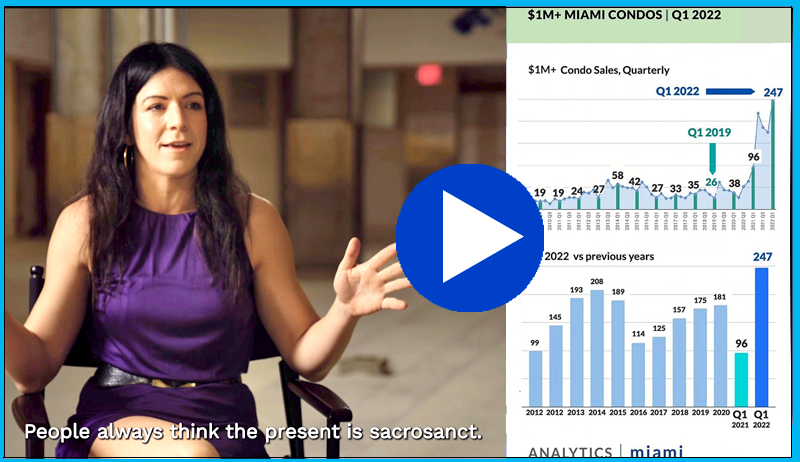
There is a fundamental disconnect between supply & demand in the Miami and Miami Beach condo markets. Inventory has steadily risen across market segments, all while transaction volume has dropped off. Higher price points are the worst offenders. The Miami $1M+ market saw a 147% increase in supply since 2013, while sales dropped 32% in the same period
Analytics Miami Condo Market Report – State of the Market 2018
Miami condo market conditions:
What this means:
We are in an environment of falling sales volume + inventory accumulation. Inventory is at all time highs, as are absorption rates. Inventory has to clear before conditions can improve. For inventory to clear, prices likely have to drop. Through 2018, it will be important to keep an eye on inventory numbers to recognize when we come to an inflection point. Also worth pointing out: the last market crash here was systemic, this time the bubble has been isolated to the high-end of the condo market. There is a great need for affordable housing, which is a point I addressed in my post about Miami's new micro unit designation.
Miami Condo Sales Volume
Volume is a leading indicator. Where volume goes, prices are likely to follow. This is especially true in an environment with simultaneously decreasing volume and increasing inventory. Furthermore, people often make purchases simply because others are purchasing. A decrease in participation is a strongly negative market indicator, as the absence of competition affects the psychology of would-be buyers.
- Miami condo sales volume closed out 2017 with a fourth consecutive year of decreasing sales volume.
- Fewer condos sold in Miami in 2017 than in 2010.
- Condos sales volume is down 26% from 2013 highs.
Miami-Dade Condo Sales, Volume by Quarter. Fourth Quarters Marked. Data Through Q4 2017.

Source: Miami MLS.
Miami-Dade Condo Sales, Volume by Year. Data Through 2017.

Source: Miami MLS.
Active Listing Count & Aggregate $ Value of Active Listings
2017 ended with the aggregate $ value of listings at all-time highs: $14,943,069,363.
Every month of 2017 had an aggregate active listing value over $14B. This is up
considerably from 2016, where each had a value in the $13B range.
Aggregate value is trending up while the active listing number is relatively flat due to the build-up in
higher priced condo listings.
Miami-Dade Condos, Total Number of Active Listings. Charted monthly through 2017.

Source: Miami MLS.
Miami-Dade Condos, Aggregate Value of Active Listings. Charted monthly through 2017.

Source: Miami MLS.
The Bubble was in the High-End Miami Condo Sector.
Locally Supported Price Points are Transacting.
Steep volume drop-off starts at $500K, where there are 40+ months of inventory.
Miami is a divided market
Markets that depend on buyers from outside the area continue to suffer, while local buyers are still plentiful.
The condo market slowdown starts at about $325K. Price points below $325K are supported by local demand and transaction volume is at all-time highs. Local condo demand starts to wane significantly at prices lower than even $500K. At $500K we start to see a significant drop-off in transaction volume. Past $1M the lack of outside buyers is a major factor and there is currently 50 months of inventory.
$200K - $325K Miami condo price range -> the only segment with transaction volume growth.
Miami is experiencing steady population growth, and the $200K - $325K price range caters to local demand. All other price ranges are seeing steady decreases in transaction
volume.
Miami-Dade Condos Sales Volume: $200K - $325K. Charted annually through 2017.

Source: Miami MLS.
Miami-Dade Condos Sales Volume: $500K - $999K. Charted annually through 2017.

Source: Miami MLS.
Miami-Dade Condos Sales Volume: $1M - $2.99M, $3M+. Charted annually through 2017.

Source: Miami MLS.
Miami-Dade Condos Number of Active Listings: $1M+. Charted annually through 2017.

Source: Miami MLS.
The pattern holds in all neighborhoods: transaction volume is dropping past $500K
Drill down to Miami Beach: 57 months of inventory for condos $1M+.
Miami Beach Condo Inventory Is At All-Time Highs
$500K - $999K months of inventory: 33.7
$1M - $2.99M months of inventory: 48.3
$3M+ months of inventory: 86.4
In December 2017:
11 condos sold in Miami Beach priced between $1M - $2.99M.
3 condos sold in Miami Beach for $3M+. There were 288 active listings.
The luxury condo market is still in the inventory accumulation phase, as 2017 closed out at all time highs in that regard. Inventory has to clear for pressure to come off prices. We are starting to see luxury properties sell at significant discounts off their asking prices, but the issue remains that there are so few bids past $3M and so much inventory. We will have to see how this plays out.
Miami Beach Condos, $1M+ annual sales volume. Charted through 2017.

Source: Miami MLS.
Miami Beach Condos, $1M+ months of inventory / absorption rate. Charted monthly 2017.

Source: Miami MLS.
The Miami Condo Market Is Still Not Back To Old Highs.
We continue to see a steady up-tick in both median and average condo price, although we are still off 2007 highs.
Miami-Dade Condos Average & Median Prices. Charted annually through 2017.

Source: Miami MLS.
The locally supported market is healthy and is trending upwards. Pressure in this cycle is on the high-end ($500K+), outside-money reliant segments.
Note: this chart does not take inflation into account. The USD has lost approximately 18% of its value since 2007. If we were to take inflation into account, prices would be further from highs than this chart suggests.
In Conclusion:
There is great demand for affordable housing in Miami, as it is a growing city. The condo over-supply is very much at price points over $500K. I have spoken about this need for affordable housing before, and have recently written about Miami's new micro-unit designation. While the high-end sorts itself out, there is opportunity to align with the city's growth and natural demand.
Contact me for: off-market hotel deals, land deals and hotel marketing.
I have one of the largest private databases on Miami hotel transactions.
Related Posts